Wednesday, August 06, 2014

iRegulon: From a Gene List to a Gene Regulatory Network Using Large Motif and Track Collections

Identifying master regulators of biological processes and mapping their downstream gene networks are key challenges in systems biology. iRegulon is a software that implements a genome-wide ranking-and-recovery approach to detect enriched transcription factor motifs and their optimal sets of direct targets. The software can be obtained from this website


Figure 1 Regulon detection by rank-based motif discovery and motif2TF.

Tuesday, August 05, 2014

Circleator: Flexible Circular Visualization of Genome-Associated Data

Came through this interesting package which builds graphs similar to Circos but just a little easier

“Circleator is a Perl application that generates circular figures of genome-associated data. It leverages BioPerl to support standard annotation and sequence file formats and produces publication-quality SVG output. It is designed to be both flexible and easy to use. It includes a library of circular track types and predefined configuration files for common use-cases, including: 1. visualizing gene annotation and DNA sequence data from a GenBank flat file,
2. displaying patterns of gene conservation in related microbial strains,
3. showing SNPs and indels relative to a reference genome and gene set, and
4. viewing RNA-Seq plots.”

Monday, August 04, 2014

Greater Collagen-Induced Platelet Aggregation Following Cyclooxygenase 1 Inhibition Predicts Incident Acute Coronary Syndromes

Platelets have several pathways that initiate aggregation such as thrombin-, collagen-, thromboxane-, and ADP-mediated pathways. Individuals vary widely in their ability to have platelet aggregation through each of these pathways. Furthermore, this variability is not correlated. In other words, an individual may have low aggregation though one pathway but may have high aggregation through another pathway. This phenomenon may be more important when we try to measure platelet aggregation the laboratory to assess whether there is increased risk of in vivo platelet aggregation (and hence cardiovascular events).

Collagen is one of the first agonists that initiates platelet aggregation at the site of vessel wall injury. Therefore, examining an association of collagen-mediated platelet aggregation with subsequent cardiovascular events makes sense. Moreover, if we can decrease variability in platelet aggregation by blocking one or another pathway, we may be better able to assess activation through collagen pathway.

Aspirin is commonly used for prevention of cardiovascular disease and works by inhibiting thromboxane-pathway an dis very effective in completely inhibiting activity through this pathway. Thus aspirin can be used to inhibit variability through one pathway and effect of collagen can be studied with fewer interactions. We followed the same logic in this paper where we examined platelet aggregation after 2-week aspirin therapy in healthy individuals. Most of these individuals did not use aspirin after the 2-week study period. During follow-up increased collagen-mediated platelet aggregation was significantly associated with acute coronary syndrome.

“After COX1 pathway inhibition, collagen-induced aggregation was significantly greater in participants with ACS compared with those without (29.0 vs. 23.6 ohms, p < 0.001). In Cox proportional hazards models, this association remained significant after adjusting for traditional cardiovascular risk factors (HR = 1.10, 95%CI = 1.06-1.15; p < 0.001).”

Sunday, August 03, 2014

The Science Publishing Complex – <1% publish 42% of all papers

There are not as many successful scientists as we think there are – most are just trying (or leaving).

“Using the entire Scopus database, we estimated that there are 15,153,100 publishing scientists (distinct author identifiers) in the period 1996–2011. However, only 150,608 (<1%) of them have published something in each and every year in this 16-year period (uninterrupted, continuous presence [UCP] in the literature). This small core of scientists with UCP are far more cited than others, and they account for 41.7% of all papers in the same period and 87.1% of all papers with >1000 citations in the same period.”

Saturday, July 19, 2014

The End of HDL-raising Therapies?

Patients with cardiovascular disease are at increased risk of subsequent events than individuals without a history of cardiovascular disease despite optimal medical management. Various strategies has been proposed to decrease this increased risk among them increasing HDL.

The HPS2-THRIVE trial examined this question by randomly assigning almost 26,000 individuals with established vascular disease to either placebo or Naicin+laropiprant; a combination that should raise HDL cholesterol. Participants were followed for a median period of 3.9 years. Individuals randomized to the treatment arm had lower LDL (about 10 mg/dL) and higher HDL (about 6 mg.dL) than those who were randomized to placebo. During follow-up, there was no difference in the incidence of major cardiovascular events between the two groups13.2% vs. 13.7%; p = 0.29). On the other hand, individuals randomized to the treatment arm had increased incidence of adverse events such as poor diabetes control or increased incidence of new diagnosis of diabetes.

For now, this trial, puts to rest the use of niacin for decreasing the risk of cardiovascular disease. However, it also raises important questions about the interest in the development of pharmacological therapies directed towards raising HDL-cholesterol. It further questions our current understanding of the role of HDL in the pathogenesis of cardiovascular diseases.

Monday, March 31, 2014

High-Platelet Reactivity and Stroke

Nevio Taglieri, and his colleagues from the University of Bologna (Bologna, Italy), conducted a meta-analysis of 14 studies (collectively enrolling 11,959 patients) to evaluate the risk of stroke in patients who had platelet testing while undergoing percutaneous coronary intervention (PCI). Among the studies included in the meta-analysis, prevalence of high platelet reactivity was 30% ±15% (range, 6% to 67%). As expected, prevalence of platelet hyperactivity was higher in studies using VerifyNow than in those using light-transmission aggregometery (LTA) (42% ±13% vs 22% ±10%; P = 0.006). Overall, the annual stroke rate was 0.9%. After pooled analysis, the risk of stroke was higher in patients with high platelet reactivity than in those without (1.2% vs 0.7%; RR 1.84; 95% CI 1.21-2.80).

The study provides interesting insights: first, it confirms the role of platelet aggregation in the athero-thrombo-embolic phenomena. Secondly, it suggests that there is a group of people who, despite having complete (near complete) blockage of P2Y12 receptors, may have higher activity through other platelet aggregation pathways and may benefit from a different drug. Of note, most patients in this meta-analysis were already on clopidogrel and aspirin, two of the several platelet aggregation pathways.

Monday, October 21, 2013

Triple Anti-platelet Therapy

Role of platelets in acute coronary syndromes (ACS) is well established. Anti-platelet agents are standard of care for the prevention of ACS. However, due to the high risk of bleeding, anti-platelet agents except aspirin are not indicated for the prevention of ACS in primary prevention population as the risk of an ACS event is low. However, individuals with established CAD are at an increased risk of subsequent events and aspirin is indicated for such patients. In addition, those who has had a stent placed, usually get dual anti-platelet therapy (aspirin + either clopidogrel, prasugrel, or ticagrelor). One would imagine that in a very high-risk population, inhibition of an additional pathway may provide additional benefit. However, the TRACER trial, found that addition of vorapaxar, an oral protease-activated-receptor 1 (PAR 1) antagonist that inhibits thrombin-induced platelet activation, had no additional benefit in patient with acute coronary syndrome. In stead, addition of vorapaxar to the standard dual anti-platelet regiment was associated with increase risk of major bleeding. This study, suggested that perhaps too much of platelet inhibition may not be beneficial for ACS prevention but increases risk of bleeding.

More recently, a meta-analysis found that adding cilostazol, another anti-platelet agent that acts by inhibiting phosphodiestrase, to standard dual anti-platelet therapy was associated with 36% reduction in major adverse cardiac events (MACE; odds ratio (OR) = 0.64; 95% confidence interval (CI) = 0.51-0.81, P < .01), a 40% reduction (OR = 0.60, 95% CI = 0.44-0.80; P < .01) in target vessel revascularization (TVR), a 44% reduction (OR = 0.56, 95% CI = 0.34-0.91; P = .02) in target lesion revascularization (TLR) and a 47%/44% reduction in in-segment/in-stent restenosis (P < .01) and lower in-segment/in-stent late loss (P < .01). The effect sizes are large showing that the addition of cilostazol is very effective in reducing events. Cilostazol also inhibits smooth muscle contraction resulting in peripheral arterial dilatation. It is possible that the beneficial effect may be due to a combination of these two effects.

Thursday, October 17, 2013

Thrombocytopenia in vWD type 2B

Von Willebrand factor (vWF) is a chaperone protein for coagulation factor VIII and is essential for the recruitment of platelets to the growing thrombus under conditions of high shear stress usually present in the arterial system. Deficiency (quantitative or qualitative) of vWF is associated with bleeding tendency, clinically known as von Willebrand disease (vWD).   Type 2 vWD is due to functional defect in vWF and type 2B is associated with gain-of-function mutations in the exon 28 of vWF gene resulting in an increase in the affinity of VWF for platelets. The region encoded by exon 28 binds to the platelet vWF receptor, glycoprotein Iba (GpIba). Patient with type 2B vWD present with bleeding and moderate to severe thrombocytopenia as well as a decreased in the high molecular weight vWF multimers. Thrombocytopenia is associated with the presence of giant platelets and spontaneous platelet aggregates. The molecular mechanism underlying the thrombocytopenia are unclear.

GpIba is present on the surface of megakaryocytes as well on platelets. Thus it is possible that interaction of mutated vWF from patients with type 2B vWD with megakaryocytes results in decreased platelet formation and release of giant platelets. In fact, Nurden et al showed that this may be the case. They showed that culture of megakaryocytes from controls performed with or without purified vWF had a positive influence on platelet production with specific inhibition by an antibody blocking vWF binding to GpIba . Megakaryocytes cultured with vWF from patients with type 2B vWD showed disorganized demarcation membrane system and abnormal granule distribution when examined under electron microscopy. The platelets produced from such megakaryocytes had abnormalities similar to those found in patients with vWD type 2B. This impaired megakaryocytopoiesis could not only explain the occurrence of giant platelets, but also contribute to a lower platelet count in VWD type 2B patients.

In addition to defects in platelet production, there may also be defects in platelet utilization, that is increased uptake of platelets (with attached vWF) by the monocyte-macrophage system of the body. Casari et al showed that this is also the case in a series of experiments reported here. They found that vWD type 2B platelets have a shorter circulatory half-life than wild-type (wt) platelets, which could contribute to the lower platelet counts in vWD type 2B mice. Further analysis revealed that VWF type 2B is present at the surface of platelets of thrombocytopenic
vWD type 2B mice, and that these vWF/platelet complexes were taken up efficiently by macrophages in liver and spleen. Thus, they provide direct evidence that part of the thrombocytopenia in vWD type 2B can be explained by an increased clearance of VWF/platelet
complexes.

Monday, October 07, 2013

Thursday, September 26, 2013

Explanation of different options for normalizations in Cufflinks

This is the best explanation that I have seen so far on the different normalization schema available in Cufflinks and how it affects calculation for FPKM. I am copying it directly from the thread which can be seen here

“With cufflinks you can have three different normalizations: fragments mapped to genome (in millions), fragments mapped to transcriptome (in millions: --compatable-hits-norm) or upper quartile (-N). Regardless of the normalization the same number of reads is quantified at each gene. I've looked into it myself. If you run cufflinks using all three of those normalizations then look at each of the separate isoforms.fpkm_tracking files you can confirm it. Check for the coverage and FPKM columns. You should see different FPKMs but identical coverages across the three quantifications. Furthermore if you divide the FPKMs by each other you should see that at each gene there's a constant ratio between the FPKMs.

If you calculate FPKMs yourself you can see why the numbers shift around. To be honest the "FPKM" designation is misleading when you're using any normalization other than "mapped reads in millions". Right? Fragments per kilobase per million mapped reads is what you're used to.
So say we have a gene that's 2500 bases long. We've got 121 fragments that mapped to it and we've got 34.7 million fragments mapped to the genome. We can get the FPKM like so..

FPKM = 121/(34.7*2.5) = 1.394813

Say only 27.4 million fragments mapped to the transcriptome. So if you used --compatible-hits-norm then the calculation looks like this:

FPKM = 121/(27.4*2.5) = 1.766423

Those aren't that different from one another. Now if you use upper quartile we're talking about the upper quartile value of fragments mapped to genes in the sample. That number might be something like 12,000. Divide this value by 1e6 to put it into "millions" like you do with mapped fragments it becomes 0.012. So now the calculation looks like this:

FPKM = 121/(0.012*2.5) = 4033.333

So maybe it makes sense to scale the upper quartile normalization value by 1000 so that the "FPKM" comes out as 4.033 instead of 4033. That's reasonable. But it really shouldn't be called an FPKM because if you think about it it's like someone telling you there are 14 cars outside and you assume they mean 14...but they actually told you 14 in base 16 which would be 20 in base 10 (or maybe like expecting a measurement to be in cm but you're given the measurement in inches with a cm designation). It's not fragments per kilobase per million mapped reads, it's fragments per kilobase per upper quartile of read counts @ genes. So FPKPUQRCG. That name sucks.

The point of these different normalizations is only applicable to when you're comparing samples to each other. So if you're goal is to see if gene X is expressed higher in Sample A verses B then regardless of the normalization used (as long as you use the same one on both samples) you'll find your answer. The upper quartile normalization has been showing to be more robust so maybe it's better to use it for comparing samples to one another. Also, obviously, for the expression levels to make sense to other people we all need to be using the same normalization. We should probably all be using upper quartile normalization but that puts the numbers on a different scale than we used to seeing.”

Wednesday, July 31, 2013

Extracting phenotype type by genotype using GenABEL

GenABEL is an excellent R package for GWAS studies. It uses special data structure to efficiently store data. The data structure is quite useful and results in remarkable time saving when running GWAS, it does have some limitations. For example, often in GWAS studies one need to know phenotype distribution across genotype of some variant but I couldn’t find a straightforward way of looking at phenotype distribution across genotypes (there may be a better way of doing it but I couldn’t find it)

To get phenotypic information across genotypes I used the following approach (assuming that data is in an object called ‘data’

1. Abstract phenotypic information
pheno<- phdata(data)
The returned object is a dataframe and can be confirmed with class(pheno) command

2. Abstract SNP data
snps <- as.character(data[, c("SNP1", "SNP2", "SNP3")])
You can change as.character in the line above with as.numeric if you want to get genotype information in 0,1,2 format.
The returned object is a matrix with row numbers as subject ID. Thus we need to do two things with this matrix. First we have to convert it into a dataframe and then we have to convert rownames into a column of id

3. Convert matrix 'snps' into a dataframe with row names as an additional column
snps.df<-data.frame(as.numeric(rownames(snps)),snps)
colnames(snps.df)[1]="id"
                          ### Change the column name to 'id'
snp.data <- merge(pheno, snps.df, by="id")  

Now you have a dataframe with phenotype data and SNPs genotype data

Sunday, June 30, 2013

Downloading and Merging NHANES datasets in R

The National Health and Nutrition Examination Survey (NHANES) is a program of studies designed to assess the health and nutritional status of adults and children in the United States. The survey is unique in that it combines interviews and physical examinations. The data files for more recent surveys are given in SAS Export format. To read these files in to R, one needs to use functions in the foreign package. If you don’t have this package, you may need to install it first. In the first step, we download these files and then in the second step we import these files to R.

# load foreign package (Converts data files into R)
require(foreign)    

# Set your working directory
setwd( "<YOUR WORKING DIRECTORY>")

### Download demographics file of NHANES 2005-2006 dataset
download.file(
ftp://ftp.cdc.gov/pub/Health_Statistics/nchs/nhanes/2005-2006/DEMO_D.XPT,
"Demo0506.xpt", mode='wb')

###Read downloaded file
Demo56<-read.xport("Demo0506.xpt")

### Download Blood pressure file of NHANES 2005-2006 dataset
download.file(
ftp://ftp.cdc.gov/pub/Health_Statistics/nchs/nhanes/2005-2006/BPX_D.XPT,
"BP0506.xpt", mode='wb')

### Read downloaded file
BP56<-read.xport("BP0506.xpt")

### Merge the two files
N_05_06 <- merge(Demo56, BP56, all=T)

You can download several files and then merge them together to get your dataset.

Saturday, June 29, 2013

Updating R – in Windows 7

R is a great statistical software with tremendous flexibility. However, there is not a very straightforward (point and clinic) way of updating it. R Users have developed several different methods of updating R with its packages, including one described on CRAN.

I came across this one post, it is about updating R on Mac; tried it on Windows 7 with minor changes and it worked fine.

So here is what I did:
First, in the older version I wrote following commands
tmp <- installed.packages()
installedpkgs <- as.vector(tmp[is.na(tmp[,"Priority"]), 1])
save(installedpkgs, file="installed_old.rda")

Then I downloaded and installed newer version of the R. In the newer version of R I wrote following commands:
source(
http://bioconductor.org/biocLite.R)
biocLite()
load("installed_old.rda")
tmp <- installed.packages()
installedpkgs.new <- as.vector(tmp[is.na(tmp[,"Priority"]), 1])
missing <- setdiff(installedpkgs, installedpkgs.new)
for (i in 1:length(missing)) biocLite(missing[i])

All packages were automatically installed to the newer version. Then, I went to Windows Control Panel and uninstalled the older version of R.

That’s it!

Wednesday, May 22, 2013

Some R Code Using SAScii

For example, I want use Adult Demographic File from NHANES III. To import it using SAScii

library(SAScii)
SAScode <- "ftp://ftp.cdc.gov/pub/Health_Statistics/NCHS/nhanes/nhanes3/1A/adult.sas"
ftpdata <-"ftp://ftp.cdc.gov/pub/Health_Statistics/NCHS/nhanes/nhanes3/1A/adult.dat"
data <- read.SAScii(ftpdata, SAScode, beginline=5)

Because the line with INPUT in the SAS code file begins at line 5, I gave the option begineline=5. Of course, it assumes that you have downloaded and installed the package ‘SAScii’. Now you can save this file in any desirable format or use it for further downstream analysis. It does take quite sometime, longer than what it would take using SAS, but it does produce desired output.

Tuesday, May 21, 2013

An Interesting R Package–SAScii

For several surveys, such as NHANES III, data for many files is available in ASCII format with SAS code. However, those of us, who want to use that data in R, it is little cumbersome to use first SAS, import data into it, then transfer data into a format that can be imported into R. I came across of this relatively new package, SAScii, that uses the ASCII format and then SAS code to directly import data into R. Quite nice.

REDUCE Trial – My Thoughts

This week, REDUCE trial was published in JAMA “Short-term vs Conventional Glucocorticoid Therapy in Acute Exacerbations of Chronic Obstructive Pulmonary Disease; The REDUCE Randomized Clinical Trial” JAMA. 2013;():1-9. doi:10.1001/jama.2013.5023.

REDUCE (Reduction in the Use of Corticosteroids in Exacerbated COPD), was a randomized, non-inferiority multicenter trial in 5 Swiss teaching hospitals that enrolled 314 patients (between March 2006 through February 2011) who had presented to the emergency department with acute COPD exacerbation and were past or present smokers (≥20 pack-years) without a history of asthma. Participants were treated with 40 mg of prednisone daily for either 5 or 14 days in a placebo-controlled, double-blind fashion. The predefined non-inferiority criterion was an absolute increase in exacerbations of at most 15% or a 6 months follow-up. The trial found that 5-day treatment with systemic glucocorticoids was non-inferior to 14-day treatment with regard to re-exacerbation within 6 months of follow-up but significantly reduced glucocorticoid exposure.

The trial results are interesting for those of us who actually practice medicine and see COPD patients on a regular basis with exacerbations. There are three settings in which the results of this trial can potentially impact practice. In office practice, there are definitely some patients who would do just fine with 5 days course of prednisone and these are patients who get prescribed Medrol dose pack. On the other hand, there are patients who need longer courses of steroids and for such patients it is important to give them longer courses of steroids (up to 14 days and sometimes even longer) to keep them out of hospital. Interestingly, based on only the severity of the patient’s symptoms and signs alone, it is impossible to predict who will need longer treatment. It is only history of the patients that tells what will work. The practice in Emergency Department is unlikely to be much different than in an office setting except that there may be patients with more severe exacerbation. There too, history is the only helpful thing. However, once patients are admitted to the hospital, it is likely that these are those subsets of patients who didn’t respond as quickly to steroids in ED and thus needed admission with persistent severe symptoms. For such patients, it remains a possibility that a larger number (if not all) of them will need longer therapy.

Thus, in my view, if a patient is new to me and presents with COPD exacerbation and I don’t have historical information on this patient, I will feel comfortable in giving this patient a 5-day course of steroids. Otherwise, if I have some additional information telling me that shorter course will not be helpful, I should go for longer course.

Monday, April 15, 2013

VPREB3 and Platelets

VPREB3 protein is the human homolog of the mouse VpreB3 (8HS20) protein, and is specifically expressed in cell lines representative of all stages of B-cell differentiation. It is also related to VPREB1 and other members of the immunoglobulin supergene family. This protein associates with membrane mu heavy chains early in the course of pre-B cell receptor biosynthesis. The precise function of the protein is not known, but it may contribute to mu chain transport in pre-B cells.

This protein doesn’t appear to be detectable in platelet proteome studies but its transcript is present in platelets (detected by both RNA-seq and microarray studies). Its role in platelet biology remains unclear. Even interesting is that the RNA-seq experiment found a much lower expression level than the microarray experiment (0.15 RPKM vs. 27250 MFI). Perhaps the level of gene expression is quite variable from person to person.

CD23 and Platelets

CD (Fc Epsilon Receptor II), has been shown to be present in platelets and may play a role in platelet aggregation. However, none of the publically available platelet proteome databases (Martens et al. Proteomics 2006; Burkhart et al, Blood 2012; Vaudel et al, Journal of Proteome Research 2012) have found this specific protein in platelets. When looking at transcriptome, CD23 RNA doesn’t appear to be present in megakaryocyte (using microarray). However, platelet RNA-seq analysis have found low levels of transcript in platelets (RPKM = 0.37).

While it is easy to speculate why there is such a discrepancy, it is possible that CD23 is induced in people with some allergy exposure and in individuals who are otherwise healthy (as were people in the studies that failed to find CD23), this transcript and its product may not be detectable.

It will be worthwhile to look at individuals with allergic responses (or parasitic infections) and examine whether they have higher expression of CD23 gene and protein. Comparing platelet aggregation in individuals with allergies and those without may also be illuminating.

Tuesday, March 12, 2013

Here comes STREAM ……

The results of STREAM were presented at ACC meeting and study was published online in NEJM – “Fibrinolysis or Primary PCI in ST-Segment Elevation Myocardial Infarction”. In nutshell the results can be summarized as pre-hospital fibrinolysis with bolus tenecteplase in conjunction with timely coronary angiography was similar to primary PCI in patients with early STEMI who could not undergo primary PCI within 1 hour after the first medical contact. Patients who failed fibrinolysis underwent emergent PCI (36.3% of the fibrinolysis group). Cardiogenic shock and congestive heart failure occurred more often in the primary PCI group and intracranial hemorrhage and ischemic strokes were more frequent in the fibrinolysis group. The study findings are likely to be reassuring for some parts of the world while may change treatment strategies at other places.

Friday, December 21, 2012

Monday, November 19, 2012

Farnesyl Pyrophosphate and ADP-mediated Platelet Aggregation

Read this article recently and it seems interesting. Farnesyl pyrophosphate (FPP) can itself activate platelets and can induce platelet aggregation. However, this study concludes that FPP can act as endogenous antithrombotic factor by acting as insurmountable antagonist of ADP-mediated platelet aggregation. FPP is an intermediate in the cholesterol biosynthetic pathway. FPP also serves as a donor in post-translational isoprenylation of proteins. The steady-state plasma level was reported to be 6.6 ng/ml,  but  even  the  mild  physiological alteration caused by eating a meal has been demonstrated to increase the plasma concentration 200 fold. FPP is a natural antagonist of the LPA2  (lysophosphatidic acid type 2) and LPA3  receptors, and an agonist at the LPA4  and LPA5 receptors. While these receptors are present in platelets, FPP doesn’t appear to act through these receptors. Hogberg et al realized that the structure of ADP and FPP is similar as are their receptors. Thus, through a series of experiments they should that FPP inhibits platelet aggregation by blocking ADP receptors.

Friday, November 16, 2012

Platelet Function and Subsequent MACE in ACS patients

An interesting substudy of TRILOGY ACS was published in JAMA recently in which a group of patients with ACS underwent evaluation of platelet function after prasugrel or clopidogrel. All patients were also on aspirin. Thus, platelet function studies were performed after treatment with aspirin + prasugrel and aspirin + clopidgorel. TRILOGY ACS trial was a randomized, double-blind, active-comparator trial comparing prasugrel with clopidogrel in patients with unstable angina or non–ST-segment elevation myocardial infarction (UA/NSTEMI) who were managed medically without planned revascularization.Platelet function was assessed in a subset of enrolled patients using VerifyNow kits. VerifyNow P2Y12 is a whole-blood, turbidimetric-based assay that measures platelet agglutination to fibrinogen-coated polystyrene beads after platelet activation with adenosine diphosphate. The results are expressed in PRU (P2Y12 reaction units). There was no significant association between platelet reactivity and occurrence of ischemic outcomes during a 30 month follow-up period.

The results of this study are important; it is a large study, enrolling a high-risk population and followed for a relatively longer period of time. While trials of antiplatelet agents have established, beyond doubt, that platelet play an important (if not essential) role in the pathogenesis of ACS and perhaps also in the development and progression of atherosclerosis, studies have generally failed to find an association of platelet function with future events. Probably the most likely explanation is that we have, so far, been unable to identify a platelet function test that ACTUALLY measures platelet function in a way which is important clinically. We can predict bleeding but not aggregability. We do need to explore existing platelet function tests for association with future events that have not yet been examined and we also need to develop newer tests that are more closer in measuring what happens inside the vessel.

Tuesday, August 28, 2012

WOEST - Optimal Antiplatelet Treatment in Patient Already taking Anticoagulants

Dual antiplatelet therapy (aspirin and clopidogrel or another P2Y12 inhibitor) is almost always prescribed (and is beneficial in preventing future adverse cardiovascular events) to patients with coronary artery disease who undergo coronary intervention and have stents placed (although it is associated with increased risk of bleeding). For most patients with atrial fibrillation or mechanical heart valves, anticoagulation therapy is a the standard of care (although it is associated with increased bleeding risk).

Question remains as to what to do with patients who are on anticoagulation but then develop coronary artery disease, undergo percutaneous coronary intervention (PCI) and stent placement. Use of dual antiplatelet therapy along with anticoagulation increases the overall risk of bleeding considerably and whether such a high risk of bleeding overshadows the benefit associated with dual antiplatelet therapy remains unknown.

In an ideal situation, one would randomize patients who are taking anticoagulants and who have undergone PCI with stent placement in one of the three arms: dual antiplatelet therapy, aspirin alone, or clopidogrel (or another P2Y12 agent) alone. Of course, all the three groups should continue taking their anticoagulation treatment. While, we don’t have such an ideal study, we do have results of a study (reported today in the ESC Congress 2012) in which patients taking anticoagulants were randomized to dual antiplatelet agents or clopidogrel alone. The results are interesting; not only that dual antiplatelet therapy in addition to anticoagulation was associated with increased risk of bleeding, it was also associated with higher risk of all-cause mortality (6.4% vs. 2.5%; p = 0.027).

One thing is certain from this study and that is that dual antiplatelet therapy, in addition to anticoagulation, is not optimal treatment and a single antiplatelet agent is likely to do a better job in reducing not only bleeding but also in decreasing all-cause mortality. However, whether this single antiplatelet agent has to be aspirin or clopidogrel, that remains unclear. In fact, it is quite possible that aspirin may have larger benefit than clopidogrel when used in such population. Perhaps future studies may be better able to point us relative benefits of antiplatelet agents in patients with PCI and stents who are also taking anticoagulants.

Sunday, August 26, 2012

Clopidogrel vs. Prasugrel in Medically Managed ACS

Clopidogrel (famous by its brand name Plavix) is now generic and while prices vary from one pharmacy to another, it is very likely that very soon its price will come down. On the other hand, Prasugrel (which works the same way as clopidogrel) has a long way to go before it becomes generic and thus is likely to remain costly for next several years.

Prasugrel has one advantage over clopidogrel; its metabolism is not dependent on CYP2C19 (a member of cytochrome P450 system). A mutation within the gene of this particular enzyme decreases its function and decreases the conversion of the pro-drug, clopidogrel, into its active metabolite. The metabolism is shunted towards inactive metabolites and hence individuals with certain mutations in this gene are associated with increased platelet reactivity while on clopidogrel. This was shown conclusively in a GWAS by Alan Shuldiner and his team.

Prasugrel does seem to be superior to clopidogrel in individuals who undergo percutaneous coronary intervention (PCI) however, it was not clear if prasugrel is also superior to clopidogrel in individuals who are managed conservatively.

The results of the TRILOGY-ACS trial (double blind, randomized, double-dummy, active control, event-driven), announced today at the ESC Congress 2012 suggest that there is no difference. In this study, investigators randomized >9,000 patients with acute coronary syndromes (ACS) to either clopidogrel+acetyl salicylic acid (ASA or aspirin) or prasugrel+ASA. The primary end point of the trial was cardiovascular death, myocardial infarction, or stroke. The study did not find a benefit of prasugrel over clopidogrel for either the primary outcome or individual components of the primary outcome (p = 0.21). Post-hoc analysis suggests some interesting hypothesis that may be worth looking into in future studies.

Ticagrelor, another anti-platelet agent that also works by inhibiting the same ADP receptors (P2Y12), on the other hand, was shown to be superior to clopidogrel in a similar type of medically managed population in the PLATO trial. It will be interesting to see how they do in their head-to-head comparison (if ever done).

Wednesday, August 22, 2012

GWAS of Correlated Traits

Korte et al has written an interesting paper which extends the analysis of correlated traits to genome-wide association studies (GWAS). (Korte A, Vilhjálmsson BJ, Segura V, Platt A, Long Q,Nordborg M. A mixed-model approach for genome-wide association studies of correlated traits in structured populations. Nat Genet. 2012 Aug 19. doi: 10.1038/ng.2376. [Epub ahead of print] PubMed PMID: 22902788.)

GWA studies have commonly employed a simple statistical model in which a single locus is tested for association with a single phenotype (usually in an additive model). There have been few attempts so far, if any to utilize correlated phenotypes and perhaps improve power of the studies. 
In the 2011 meeting of American Society of Human Genetics at Montreal, Canada, I have used one, relatively simple, method to combine results from two correlated traits with resulting increase in power of GWAS. (Qayyum R et al. Correlated meta-analysis of genome-wide association studies of agonist-mediated native platelet aggregation in African Americans). What we did was to conduct two separate GWAS studies of correlated platelet aggregation phenotypes and then combined the results using meta-analysis. However, the resulting p-values were adjusted for correlation between the two phenotypes using tetrachoric correlation. We further conformed our findings using the simulations from correlated distributions, confirming our findings. 
Korte et al, use linear mixed model approach to not only adjust for population stratification but also for correlation between phenotypes. They use ASReml and R for this analysis and provide R scripts on their website. Using their techniques, Korte et al unveil additional SNPs in a GWAS of LDL and triglycerides.


Friday, August 17, 2012

Some Interesting Articles to Read

This one claims that odds are against men because of natural selection

Extreme phenotypes are helpful in identifying genetic loci and this study provides such an example

Here is introduction to Personal Genome Project, an interesting resource.

Monday, April 09, 2012

Ornithine Decarboxylase, Aspirin, and Platelets

Ornithine Decarboxylase (gene name ODC1) is the rate limiting enzymes of the polyamine biosynthesis pathway and catalyzes ornithine to putrescine. The activity level for the enzyme varies in response to growth-promoting stimuli and exhibits a high turnover rate in comparison to other mammalian proteins. Interestingly, this enzyme (as well as its inhibitor, Ornithine decarboxylase antizyme, gene name OAZ1) is also differentially expressed at higher levels in platelets from individuals with sickle cell disease than in in those without sickle cell disease (PMCID: PMC2225987). Platelets are in a basally activated state in patients with sickle cell disease and may contribute to at least some of the long-term vascular complications seen in patients with sickle cell disease. In patients with CAD, variants in OAZ1 have shown to be associated with increased risk of 6-month in-stent restenosis, increase in carotid intima-media thickness over the a 4-year period, and an increased risk of CAD (PMID: 17761941).

Aspirin is widely used for its anti-platelet effects and is also shown to be beneficial in reducing the recurrence of colon adenomatous polyps. A recent study has found that variants located downstream of the 3’ end of ODC1 gene may influence the risk of colorectal adenoma and impact the efficacy of aspirin. (PMID: 21930798)Whether there is a similar relationship between the antiplatelet effect of aspirin and ODC1 gene variants is unknown. Although one may be tempted to postulate that such a relationship exists based on the above noted studies, there are other potential mechanisms that may play a role. For example, ornithine decarboxylase has been shown to affect proliferation of vascular smooth muscle cells (PMID: 21894530) and the function of endothelial cells (PMID: 20594968); both cell types important in the process of atherosclerosis.

Thursday, February 23, 2012

Selective Genotyping

In selective genotyping, a large number of individuals are phenotyped; however, only individuals with extreme traits are genotyped. This design tends to be more efficient than pure random sampling because phenotypically extreme individuals are likely to be genetically more informative [Huang and Lin, 2007].

Several regression-based methods have been developed for mapping QTLs under selective genotyping. These include the prospective linear regression [Xiong et al.,
2002], the retrospective likelihood approach [Wallace et al., 2006] and the conditional likelihood method [Huang and Lin, 2007]. Tang Y [2010] showed that the prospective, retrospective and conditional likelihoods actually yield identical score tests for association between a quantitative trait and a candidate locus.

Tuesday, July 26, 2011

Vancouver, Canada

All right, so I came here to Vancouver, Canada few days ago for a conference. Although I must say that I didn’t get enough time to go around and see the city, I still have only good feelings about the city. There were several things that impressed me. Probably the most striking feature was the diverse ethnic backgrounds of the people. It is very difficult, if not impossible to say where in the world you are by just looking at the people. Yes, I have been to New York many times but it was a much more diverse crowd than I have seen in Manhattan.

Weather was great; especially coming from Baltimore, from a very hot and humid weather, this was a nice break. Temperature was really moderate, pretty cold at night; cold enough that one needs an extra layer of clothing.

People were nice, polite, down to earth. City was clean, and scenery was beautiful. Stanley Park is a great place to hang out, Granville Island is a nice place for shopping. I was particularly struck by the view of snow covered peaks from the middle of the city; amazing view!

Coming back here? For sure, hopefully soon.

Wednesday, January 05, 2011

CARMIL or LRRC16A

CARMIL (protein CP ARp2/3 myosin I linker) was initially named Acan125 when it was discovered in amoeba where it was found to bind the SH3 domain of class I myosin molecules. Subsequently, this protein was found to bind capping protein (CP) and to Arp2/3 complex which to it being named as CARMIL. This is a large protein and has a long leucine-rich repeat (LRR) region. The function of this LRR region is unclear (PMID: 18544499).

CARMIL is important in actin-based cell motility. In addition to its role in many cellular process, actin is also involved in cell motility and shape change. Actin polymerization occurs mainly at the barbed ends of the actin filament. Addition of new actin molecules to the barbed ends of actin filaments are thought to be responsible for cell motility and change in shape. The assembly of actin filament by addition of actin monomers to the barbed ends is inhibited by Capping Proteins (CP). These capping proteins bind and thus hide the barbed ends of the actin filaments making them inaccessible to other actin molecules. CP is  a heterodimer of two subunits with a shape similar to a mushroom. CARMIL binds to the CP and this binding of CARMIL to CP results in decreased affinity of the CP to barbed ends of actin filament and dislodges itself from it. Thus barbed ends are exposed and actin polymerization starts resulting in cell-shape (PMID: 16434392).

Of note, the ability of CARMIL to expose barbed ends of actin filament is specific to CP and doesn’t include other proteins that inhibit actin polymerization. The CP binding region of CARMIL resides in the later part of the protein called CAH3 region (CARMIL homology domain 3; amino acid residues 940-1121). Within this region, a portion of 25 amino acids that is highly conserved from protozoa to flies, to worms to vertebrates. Point mutations in this region result in loss of CP-binding ability of CARMIL (PMID: 16434392).

A patch consisting of basic amino acids on CP is essential for its interaction with barbed ends of the actin. Using nuclear magnetic resonance (NMR), Zwolak et al  studied the interaction of the CAH3 domain and CP in a mouse model. They found that the highly basic mouse CAH3a subdomain binds with high affinity to a complementary “acidic groove” on CP.  This CAH3a-CP interaction orients the CAH3b subdomain directly adjacent to the basic patch of CP. The importance of specific residue interactions between CP and CAH3a/b was confirmed by site-directed mutagenesis of both proteins (PMID: 20630878).

In another study Hernandez-Valladares identified two similar regions  within the CAH3(965–1038) performing essentially the same two functions. The first region, Ile971–Cys1004, is CP interacting motif. The second region, Arg1021–Thr1035, binds to the underside of the CP mushroom cap on the opposite side of the CP mushroom stalk to which the CP interaction motif binds. Together, these two regions resemble a finger (CPI) and thumb (CSI) encircling the stalk on the underside of the mushroom cap (PMID: 20357771).

LRRC16A or CARMIL gene is located on chromosome 6p22.2, has 341,453 base-pairs, and 36 exons. As is also clear from the LD block of YRI (data from HapMap, software used Haploview) the later part of the gene is conserved and is present in a larger LD block.

image

Tuesday, December 28, 2010

First experience with cluster

I have been thinking about using our cluster but had been so far procrastinating until now. So this past week I thought I should submit a job myself instead of asking others to do this. Even if others submit jobs for me, I need to know some basics of working with clusters … and I mean real basics….

So, I borrowed a completely written script from a smart colleague in which I had to change few words only, basically location of files – input files and output files. And then I took that step … step of submitting a job to a computer cluster.

Result: complete failure; I have been so far unable to run that one… and I am talking about one only … job. Every time when I submit I get error “Requeued job is waiting for rescheduling”. I have still not figured out what and where the problem is. I have been asking friends and colleagues and they have been very forth coming but despite their best efforts and my repeated attempts (and prayers) I have gotten nothing but failure.

However, in the process I have learned few shell commands which I would probably have never learned … at least not this soon.

sh : submit your script

bjobs : submit your job

bjobs –lp : see why your job is still pending- this is the command that told me that my job was waiting for rescheduling or something… whatever!

bkill : get rid of the job that you have submitted

bkill –q <queue name> –u all 0 : this will kill all jobs in that queue

bhosts : shows hosts and load on them

busers : shows your submitted work/jobs

busers all : shows submitted jobs by everyone

bqueues : shows different queues

Alright, so this is enough learning so far. I have to get back to trying again and again and see if repetition of same silly things changes anything ……..Smile

Thursday, November 18, 2010

WOW! Interesting spin……

So I get these several newsletters in my email everyday …. Often I delete them without reading and sometimes I eyeball them. Today I got one from ‘MedPage Today’ (www.medpagetoday.com). The headline says “AHA: Drug-eluting stent safe in large artery disease” and then it goes on to say ...

“CHICAGO -- Among patients with coronary disease in large arteries, treatment with a drug-eluting stent was as safe as treatment with a bare-metal one, results of a large international study showed.”

The correct and realistic headline should be that “bare-metal stents are as good as drug-eluting stents (DES) in large artery disease”. In fact, this study is a win for bare-metal stent (BMS) proving that BMS can be used without any hesitation in large vessel disease. Headline on the other hand, tries to portray that it’s safe to continue using DES for large vessel disease.

Saturday, August 28, 2010

Platelets and Apoptosis

Platelet Lifespan
Various in vivo and in vitro methods can be used to determine platelet lifespan. One often recommended is the use of 111indium-labelled platelets. In this method, labeled platelets are injected into the patient and samples are collected at various time intervals (at 45 min, 2, 3, 4 hours) after injection and then daily for up to 10 days. Recovered platelets are calculated from each sample, data is plotted on an arithmetic graph paper and survival time is calculated.

What Determines Platelet Lifespan?
The lifespan of a platelet in circulation is about 8-10 days and dying platelets are continuously replaced by new platelets formed in the bone marrow. Platelets are removed from circulation either by consumption during hemostasis or through uptake by reticuloendothelial (RE) system. For the later process, initially, it was thought that platelets die due to usual ‘wear and tear’ while they are in circulation. Various lines of evidence suggested this possibility. For example, older platelets are less responsive to physiological agonists as compared to younger platelets. More recently, there is increasing evidence that platelets undergo programmed cell death through apoptosis and during this process express certain receptors on their surface that lead to uptake by RE system.

Apoptosis
There are two pathways through which apoptosis can be triggered; extrinsic and intrinsic. Extrinsic pathway is activated by the stimulation of cell-surface receptors (death receptors) which leads to the formation of Death Inducing Signaling Complex (DISC) and ultimately of caspases. On the other hand, intrinsic pathway is activated when the intracellular balance of pro-apoptotic and anti-apoptotic proteins tilt in the favor of the pro-apoptotic proteins. The pro-apoptotic proteins then trigger mitochondrial damage, which initiates the apoptosis cascade.

BCL-2 Family of Proteins
BCL-2 family of proteins is mainly responsible for intrinsic pathway of apoptosis (also called programmed cell death). There are about 25 proteins in this family. Some of these are pro-apoptotic while others are anti-apoptotic. A third subgroup within this family (BH3-only) may be involved in sensing signals that trigger programmed cell death. Anti-apoptotic proteins include Bcl-2, Bcl-w, Bcl-XL, Mcl-1 and A1 while pro-apoptotic proteins are mainly Bak and Bax. . BH3-only proteins include Bim, Bad, Bmf, Hrk, Bik, Noxa, and Puma. Together these proteins regulate programmed cell death.

Platelet Apoptosis
In a series of elegant experiments Mason et al has shown that the main anti-apoptotic protein in platelets is Bcl-XL [17382885]. They showed that mutations in Bcl-XL gene resulted in dose dependent reductions in platelet lifespan. The found that the major pro-apoptotic protein in platelets is Bak and to a minor extent Bax. Experiments in which the genes for these proteins were deleted result in doubling of the platelet lifespan. BH3-only proteins also appear to play important pro-apoptotic role in platelet lifespan as BH3-only mimetic compounds trigger apoptosis and rapid development of thrombocytopenia. In contrast, platelets from double-null mice (mice knocked out for both Bak and bax) are refractory to BH3-only mimetic compounds suggesting that the effect of BH3-only proteins is mediated through Bak and Bax.

In a study recently published study Kelly et al [19936621] showed that Bad-deficient mice had elevated platelets in their blood. They further showed that Bad is present in platelets and that bone marrow of Bad deficient mice showed normal number of megakaryocytic. They further studied the half life of platelets from Bad-deficient mice and found it to be modestly increased. To be certain that this was the intrinsic property of the platelets and not due to other host factors, they injected platelets from Bad-deficient mice into wild-type mice and found increased platelet lifespan. These series of experiments suggest that Bad acts by increasing the lifespan of platelets. On the other hand, mice deficient of another BH3-only protein, Bim, has mild thrombocytopenia. Bim appears to be involved in platelet formation by megakaryocytic and therefore, its deficiency is associated with impaired platelet formation. Interestingly, mice deficient in both Bad and Bim have normal number of platelets in their blood.

Another recent study shed some more light on the role of Bad in platelet lifespan. Catani et al [19936621] showed that activation of type-1 cannabinoid receptor by either endocannabinoid anandamide or methanandamide result in prolongation of platelet lifespan. This effect appears to be mediated though activation of Akt which, in turn, phosphorylates Bad (a BH3-only protein). A phosphorylated Bad cannot enter mitochondria and thus unable to bind and inactivate the anti-apoptotic Bcl-XL protein. Thus cytosolic sequestration of Bad results in prolongation of platelet lifespan in this model.

Monday, August 02, 2010

Vitamin D and Arterial Pulse Wave Velocity

Ok, so here is a study that continues the discussion of vitamin D supplementation to enhance health (or a surrogate of health). In this randomized trial, authors took 49 Black teens with mean age of 16.3 years and gave one group 2000 IU of vitamin D while control group was given 400 IU daily. Investigators measured carotid-femoral pulse-wave velocity (PWV) before and after 16 weeks of therapy in both groups. Investigators noticed a significant decrease in PWV in subjects taking higher dose of vitamin D (experimental group) as compared to the control group (group that was given 400 IU/day). In fact, in the control group PWV increased during the 16 week period.

This was despite the fact that both groups received vitamin D. To be sure that oral vitamin D was enough to raise serum vitamin D levels, investigators checked serum levels of vitamin D. Interestingly, serum levels increased in both groups.

Let’s see experimental group first (in nmol/L):
Baseline: 33.1
4 weeks: 55.0
8 weeks: 70.9
16 weeks: 85.7

Now PWV at baseline in the experimental group was
Baseline: 5.41 m/s
16 weeks: 5.33 m/s
p-value: 0.03

Ok, so this is relatively straightforward story so far, vitamin D was given, serum levels increased, and there was decrease in PWV. But lets see what happens with the control group; serum vitamin D levels were as below (in nmol/L):
Baseline: 34
4 weeks: 44.9
8 weeks: 51.2
16 weeks: 59.8

There is a rise in vitamin levels although not as pronounced as with 2000 IU but there is a considerable increase which is statistically significant as well. Now, if vitamin D is really effective then there should be some decrease in PWV although it might not be as much as with the high dose group, right? Lets see what was the PWV in the control group:
Baseline: 5.38 m/s
16 weeks: 5.71 m/s
p-value: 0.02

Oops! There is an increase in PWV and this is despite the fact that the serum levels of vitamin D almost doubled. In other words, this group was better off without any vitamin D supplementation. Hum! How can we interpret these findings? Is it possible that there is a cut-off after which vitamin D is effective? We know that is not the case; there is no consensus about what is the optimum level of vitamin D but it is much closer to 35 than to 60 and certainly not 80 nmol/L. Is it possible that very high vitamin D acts differently? Or is it possible that this is simply a result that happened by chance alone, that because the effect was in the correct direction and that it was consistent with the currently accepted wisdom. We don’t know but this is likely as the sample size was small. It is possible that blinding was not adequate enough and an investigator with a belief that vitamin D is effective may have interpreted PWV studies differently. We don’t know and while we don't know it is difficult to understand these results.

Sunday, August 01, 2010

Intra-individual Variability in Platelet Responsiveness to Clopidogrel

Clopidogrel, in combination with aspirin, is a commonly used anti-platelet agents after PCI (percutaneous coronary intervention) in CHD patients. In one study, about 70% of the inter-individual variability in platelet response to clopidogrel is due to hereditary factors. A polymorphism in the CYP2C19 has been shown to be significantly associated with poor platelet response to clopidogrel. Even more important, poor platelet responsiveness to clopidogrel in patients with PCI has been shown to be associated with increased MACE (major adverse cardiac events).


While focus has been generally on inter-individual variation, it is possible that there is a significant intra-individual variability. This difference can't be explained by stable factors such as genetics or gender but is likely to be due to factors that vary over a short period of time. These include inflammatory state.


In recently published study, Armero et al examined patients on two different occasions after they had clopidogrel 600 mg loading dose. Platelet reactivity was measured using VASP (vasodilator-stimulated phosphoprotein). Interestingly, they found that there was a poor intra-individual correlation between the two occasions (kappa 0.33). In 65% of patients, platelet inhibition increased on the second evaluation while in 35% of the patients, platelet inhibition decreased.


The implications of this finding are worthy of notice. This mean that there are some rapidly varying factors that can alter platelet responsiveness to clopidogrel. On potential candidate is inflammation, although this was not measured and tested as such in this study. Investigators did measure leukocyte count and fibrinogen (and there was no difference) but both are rather crude measures of low-grade inflammation. Other possibilities include poor glycemic control in diabetics; in fact, investigators did find a relationship between the presence of diabetes and poor clopidogrel responsiveness.

Friday, July 30, 2010

Mutation T@Ster: Evaluation For Disease-Causing DNA Sequence Alterations

This is a web-based bioinformatics tool for rapid evaluation for the disease-causing DNA sequence alterations. MutationT@ster integrates information from different biomedical databases and analyses evolutionary conservation, splice-site changes, loss of protein features and changes that might affect the amount of mRNA to predict consequences of a polymorphism. The test is quite fast and a typical query takes less than 0.3 seconds to complete.

Its limitations include 1) inability to analyze insertion-deletions greater than 12 base pairs, 2) inability to analyze alterations spanning an intron-exon border, and 3) analysis of non-exonic alterations is restricted to Kozak consensus sequence, splice sites and poly(A) signal.

Other software with similar capability are: 1) Panther, 2) Pmut, 3) PolyPhen and PolyPhen-2, and 4) SNAP (screening for non-acceptable polymorphisms).

Friday, October 03, 2008

Friday, August 24, 2007

Penetrance

Penetrance is the conditional probablity that P(xg) of being affected with disease x given a specific genotype g.

Penetrance is different than "Variable Expressivity" which means variations in the the degrees of manifestation of a disease.


Anticipation is a special case of variable expressivity which is that the severity of the expression becomes stronger and manifests earlier in successive generations

Age-dependent Penetrance is a phenomenon in which the penetrance depneds on the age of the individual, that is, not all individuals carrying the disease get affected but the older they are the, the higher the probability that they will be affected. Age dependent penetrance is important in genetic counselling in which not only it is important to know the probability of affecting a disease but also the probability of when will someone be affected by the disease. Age-dependent penetrance is also important in differentiating the etiologies of a disease (at least potentially).

Monday, January 15, 2007

Genetic Marker

A Genetic Marker is a special DNA locus with at least one base being different between at least two individuals. In principle, only the features of being detectable and having a known location in the human genome are required for a locus to serve as a marker.

Sunday, December 31, 2006

Risk factors as prognotic tools

There is a very nice 'perspective' in December 21, 2006 issue of New England Journal of Medicine by James Ware. It discusses that a risk factor must have a much stronger association with the disease outcome than we ordinarily see in etiologic research if it is to provide a basis for early diagnosis or prediction in individual patients. It clearly explains that If the distributions of the risk factor differ between the group that will have the outcome and the group that will not, the risk factor is associated with the outcome. If the sample size is sufficiently large and the model is properly specified, one can expect to show that the risk factor is a statistically significant contributor to a prediction model for the outcome. For the risk factor to perform well as a prognostic test for the individual patient, however, the distributions in the two groups must be sufficiently well separated to permit the selection of a cutoff value that will discriminate between the two groups with high sensitivity and specificity.

Friday, June 09, 2006

Meta-analysis - Fixed-Effects Model

Quantitative approaches to summarize all relevant information pertaining to the research question depend on the type of data that is being integrated. Currently there are two main approaches to integrating data; fixed-effects model and random-effects model.

Fixed-effects Models

These models assume that the studies included in the meta-analysis have no differences in underlying study populations, patient selection criteria, patient's response to treatment, and the methods of treatment. The apparent differences in study results are assumed to be purely due to chance during sampling. Indeed, this method assumes that individual study effects sizes are random draws from a single frequency distribution of an effect size and that the only source of variation between individual study effect sizes is with-in study heterogeneity. In other words, patients who were enrolled in different studies but were assigned the same treatment are taken to be exchangeable.

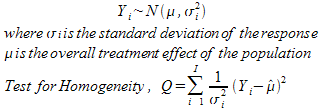
If we denote individual study effects with Yi then this model can be expressed as below

A test for homogeneity can be performed as given above to confirm the presence of homogeneity between the study effect sizes and results are compared with chi-square distribution.

Various methods for performing a fixed-effect model meta-analysis for a binary outcome have been proposed and include Mantel-Haenszel's method, Woolf's method, Peto's method, and logistic regression. Although fixed effects model is easier to develop, it has several limitations. The most important limitation is the assumption of homogeneity which is quite unrealistic and counter-intuitive. There are hardly any two studies that have similar study designs, enroll same kind of patients, and give treatment in the same manner. Even if there are such trials, it is unlikely that they have been performed at the same time, and thus may suffer from the bias due to the improvements in health care. Furthermore, above and other statistical test for homogeneity have low power and may not detect heterogeneity between the study results.

Wednesday, June 07, 2006

Role of Meta-analysis in Research

Probably the most important function of meta-analysis in Medicine is to accumulate and integrate evidence for a particular intervention. Meta-analysis is very helpful in practicing evidence-based medicine and in developing clinical guidelines. Meta-analysis can not only help us in better estimation of the overall benefit of an intervention, it can also help us in pointing to possible factors for inconsistent results in different studies. These factors can be investigated in future studies.

This leads us to the second most important role of meta-analysis in Medicine. Meta-analyses can play a key role in planning new studies. Through a systematic research of the literature meta-analysis can help us to identify which questions have already been answered and which remain to be answered. Meta-analysis can further guide us in selecting proper outcome measures or study-populations and aspects of the planned intervention that are likely to be most helpful in answering a research question.

If need for a clinical study is shown and supported with the best possible assimilation of the available clinical evidence, a funding agency is likely to support such a study. Meta-analyses can be used not only to justify the need for a new study, it can put a study protocol on a stronger footing. The meta-analysis can show the potential utility of the planned study by putting the available evidence in context. The graphical elements of the meta-analysis, such as the forest plot, provide a mechanism for presenting the data clearly, and for capturing the attention of the reviewers. Some funding agencies now require a meta-analysis of existing research as part of the grant application to fund new research.

Meta-analysis is also helpful in a researcher's career. Generally, meta-analysis and systematic reviews are considered of a higher standard than narrative reviews. Indeed, a recent study has found that meta-analysis are the most-frequently cited type of research articles. Thus, many journals encourage researchers to submit systematic reviews and meta-analyses that summarize the body of evidence on a specific question. Meta-analyses also play a supporting role in other papers. For example, a paper that reports results for a new primary study might include a meta-analysis in the discussion to synthesize prior data and help to place the new study in context.

Meta-analysis has multiple other uses in medical and non-medical fields. For example, applied researchers in education, psychology, criminal justice, and a host of other fields use meta-analysis to determine which interventions work, and which ones work best. Meta analysis is also widely used in basic research to evaluate the evidence in areas as diverse as sociology, social psychology, sex differences, finance and economics, political science, marketing, ecology and genetics, among others. Pharmaceutical companies use meta-analysis to gain approval for new drugs, with regulatory agencies sometimes requiring a meta-analysis as part of the approval process.

Tuesday, June 06, 2006

Meta-analysis in General

Explosion in the number of papers published in medical journals makes it difficult to keep pace with the primary research. Experts synthesize this accumulating knowledge in a summary for the benefit of a busy clinician. We find these reviews in all medical journals.

This traditional method of reviewing literature, commonly known as narrative review, has several disadvantages. One obvious problem is that, reviewers rarely begin with an open mind and review can be biased by their professional opinions. Further, reviewers may include only those studies that agree with their own opinions and may completely ignore studies that have reached to a different opinion.

A better way of reviewing medical literature is to develop a search strategy in order to identify all the relevant clinical trials and systematically review all these trials. Such a review is generally known as a ‘Systematic Review’. This approach should eliminate the bias resulting from selective inclusion of studies. Although a systematic review is better than a narrative review, it also has one major limitation. A systematic review is, generally, unable to reach to a conclusion without ignoring sample size, effect size, and research design of the clinical trial.

The limitation of systematic review can be dealt by statistically combining results of all relevant clinical trials. This method of reviewing literature is known as ‘Meta-analysis’. Such a review not only evaluates all the available literature on a particular topic, but also provides a summary estimate of the effect size after taking into consideration sample size, effect size and study design.

What is a Meta-Analysis?

Meta-analysis is a statistical procedure for combining data from multiple studies. When the treatment effect (or effect size) is consistent from one study to the next, meta-analysis can be used to identify this common effect with more precision than individual studies. When the effect varies from one study to the next, methods of meta-analysis can be extended to identify the reason for the variation.

Why do a Meta-Analysis?

Even a casual reader of medical literature will notice that results of clinical studies vary from one study to another. This variation in study results may not due to some problem with the study design or conduct, but rather can be due to pure chance alone. Thus, decisions about the utility of a treatment or the validity of a hypothesis cannot be based on the results of a single study. Now if we need multiple studies to identify the real effect (benefit or harm) of the treatment, we do need a mechanism to synthesize data across such studies. Narrative reviews are largely subjective, in contrast, meta-analysis applies objective formulas (much as one would apply statistics to data within a single study), to combine the results of any number of studies.

Monday, June 05, 2006

Meta-analysis - Effect Size Calculation

Before one starts planning to combine study-results, one needs to consider whether it is appropriate to combine these studies. This is important as the studies may be so different in methodology that combining them may provide misleading or unreliable results. If all studies can’t be combined, one can further evaluate whether some of the studies, with similar methodology, can be combined. For example, it may not be appropriate to combine randomized controlled trials with trials that have no control group and compare results before and after a treatment. However, it may be appropriate to combine randomized trials only or to analyze these two different types of trials separately. If studies can’t be combined meaningfully, then one should not perform a meta-analysis and instead, should stop at systematic review of the literature.

Meta-analysis is performed in two steps or levels. First step involves calculation of an effect size for each individual study. Second step is to pool the results from individual studies to calculate an overall effect size. It is important to note from this two-step or two-level approach that in meta-analysis, data is not combined from all the trials as if they are from a single trial. In other words, one can consider meta-analysis as an example of multilevel modeling.

Selection of a summary statistic to express effect size is probably one of the most important steps in performing a meta-analysis. This selection depends on the study question and the type of data at hand. There are different summary statistics for trials with events data (binary outcome) as compared to trials that report results on other scales.

In case of binary outcomes, where there are only two possibilities (for example dead or alive, sick or healthy, etc.), multiple summary statistics are available. Most commonly used summary statistics are odds ratio, relative risk ratio, relative risk reduction, absolute risk reduction, and number needed to treat. Sometimes risk ratios are expressed as percentage; however, statistical analyses are performed on original values and not on percentage values. A summary statistic should be easy to interpret and should have a reliable variance estimate which is important in performing a meta-analysis. As number needed to treat does not have such an estimate for its variance, it is not a good choice for a summary effect. Another important point is that odds ratio and relative risk ratios are combined on a natural log scale. For a typical 2x2 table following are formulas for calculating these statistics
If outcomes are on a continuous scale, choice of a summary statistic is either mean difference (if all studies used same scale for outcome measurement) or standardized mean difference (if studies used different scales for outcome measurement). For example, change in BP in response to a certain treatment is measured on the same scale and thus the summary statistic will be mean difference. On the other hand, there are multiple scales for evaluation of depression and different studies may use different scales. In such a scenario, a standardized mean-difference will be used to summarize trial results. However, pooled summary statistics obtained from meta-analysis of trials summarized with standardized mean-difference may be difficult to interpret.

Friday, June 02, 2006

Meta-analysis - Searching Relevant Studies

Once we have a research question and we have established inclusion and exclusion criteria for relevant studies, we need to determine a search strategy to identify relevant clinical trials.

In developing our search strategy, we should keep in mind that our research should find as many studies as possible, while at the same time it should be efficient. One can try to find all relevant trials ever done on a particular topic, but this is practically impossible and quite inefficient. Generally, the harder one tries to find studies, more relevant studies one will find, but after a certain number of studies are identified, every incremental effort result in a decrease in the number of identified studies. When should one stop searching for additional studies is controversial.

In general, relevant studies are identified by searching medical databases. PubMed is a database containing more than 10 million references, and more than 400,000 references are added annually. It covers more than 3900 medical journals in 40 languages (88% in English). One can put “Limits” to one’s search, which helps to decrease the number of returned references. Its major deficiencies are that it covers only about 33% of medical journals and that it only goes back to 1966. A second database is EMBASE, it is somewhat larger than PubMed, but is commercial and no free version is available. Another important source of randomized controlled trials is “The Cochrane Controlled Trials Register”. This Register includes all randomized controlled trials published in 1700 medical journals. It does not contain non-randomized clinical studies. OVID Online is another database that can be searched. Although OVID is a commercial database, one can access it through Merck Medicus website. One should remember that there is overlap between these databases and most of the articles retrieved will be the same. Other databases that can be searched are AMED, BIOSIS, CINHAL, PsycINFO, and Science Citation Index. An important aspect of search for relevant clinical trials is to perform a hand-search of references of the retrieved articles as well as relevant review articles. This search usually retrieves a significant number of relevant studies that have not been properly indexed by databases.

Whether one decides to include clinical trials that are not (yet) published in medical journals determines the next step in search. If one decides to search unpublished clinical trials, there are multiple resources that can be searched. For example, abstracts from relevant conference proceedings, ClinicalTrials.gov, CRISP database of NIH, or FDA database of clinical trials. Investigators can be contacted individually to learn about ongoing or recently completely but unpublished trials.

If properly done, a comprehensive search of the relevant clinical trials can tremendously improve the quality of the meta-analysis. On the other hand, an incomplete search will result in publication bias (to be discussed later) which can severely compromise the results and conclusion of the meta-analysis.

Thursday, June 01, 2006

Meta-analysis - Inclusion and Exclusion for Studies

Once a research question for meta-analysis has been formulated, the next step is to establish inclusion and exclusion criteria.

Research question itself guides the inclusion and exclusion criteria. It excludes studies that don't fit its four components, i.e. study population (e.g. patients with CHD), exposure (e.g. an intervention vs no intervention), control population (e.g. patients without CHD), and clinical outcome (e.g. death). Only those studies that address these aspects can be considered for inclusion.

There are other criteria that are often used:

STUDY DESIGN: e.g. randomized placebo-controlled trials, pre-post design or repeated-measure design studies, observational studies etc.

LANGUAGE: published in English only, or published in English and other languages.

PUBLICATION TYPE: e.g. articles published in peer-review journals, presented at conferences, postgraduate thesis, unpublished data, etc.

KEY VARIABLES: Only studies that give information about the key variables under study can be included. This information should be enough to calculate effect size (will discuss some other time).

TIME FRAME: a particular start date, such as 1966, to include only modern studies.

NUMBER OF SUBJECTS IN THE STUDY: Some have suggested including studies only with a large number of subjects, however, this is not generally accepted. This approach has not been evaluated fully.

DURATION OF THE STUDY: in other words length of follow-up, such as at least 12 months of follow-up etc. This is important if one is interested in the long-term effects of a particular exposure (intervention).